
Logs
Logging is important - we love logging.
Because of this, we have included an easy to find, follow and parse log output that provides an additional layer of visibility across your Knocknoc user activity, including logins, access grants, manual interactions, as well as Administrative and management operations.
Logs in the admin portal
Audit logs
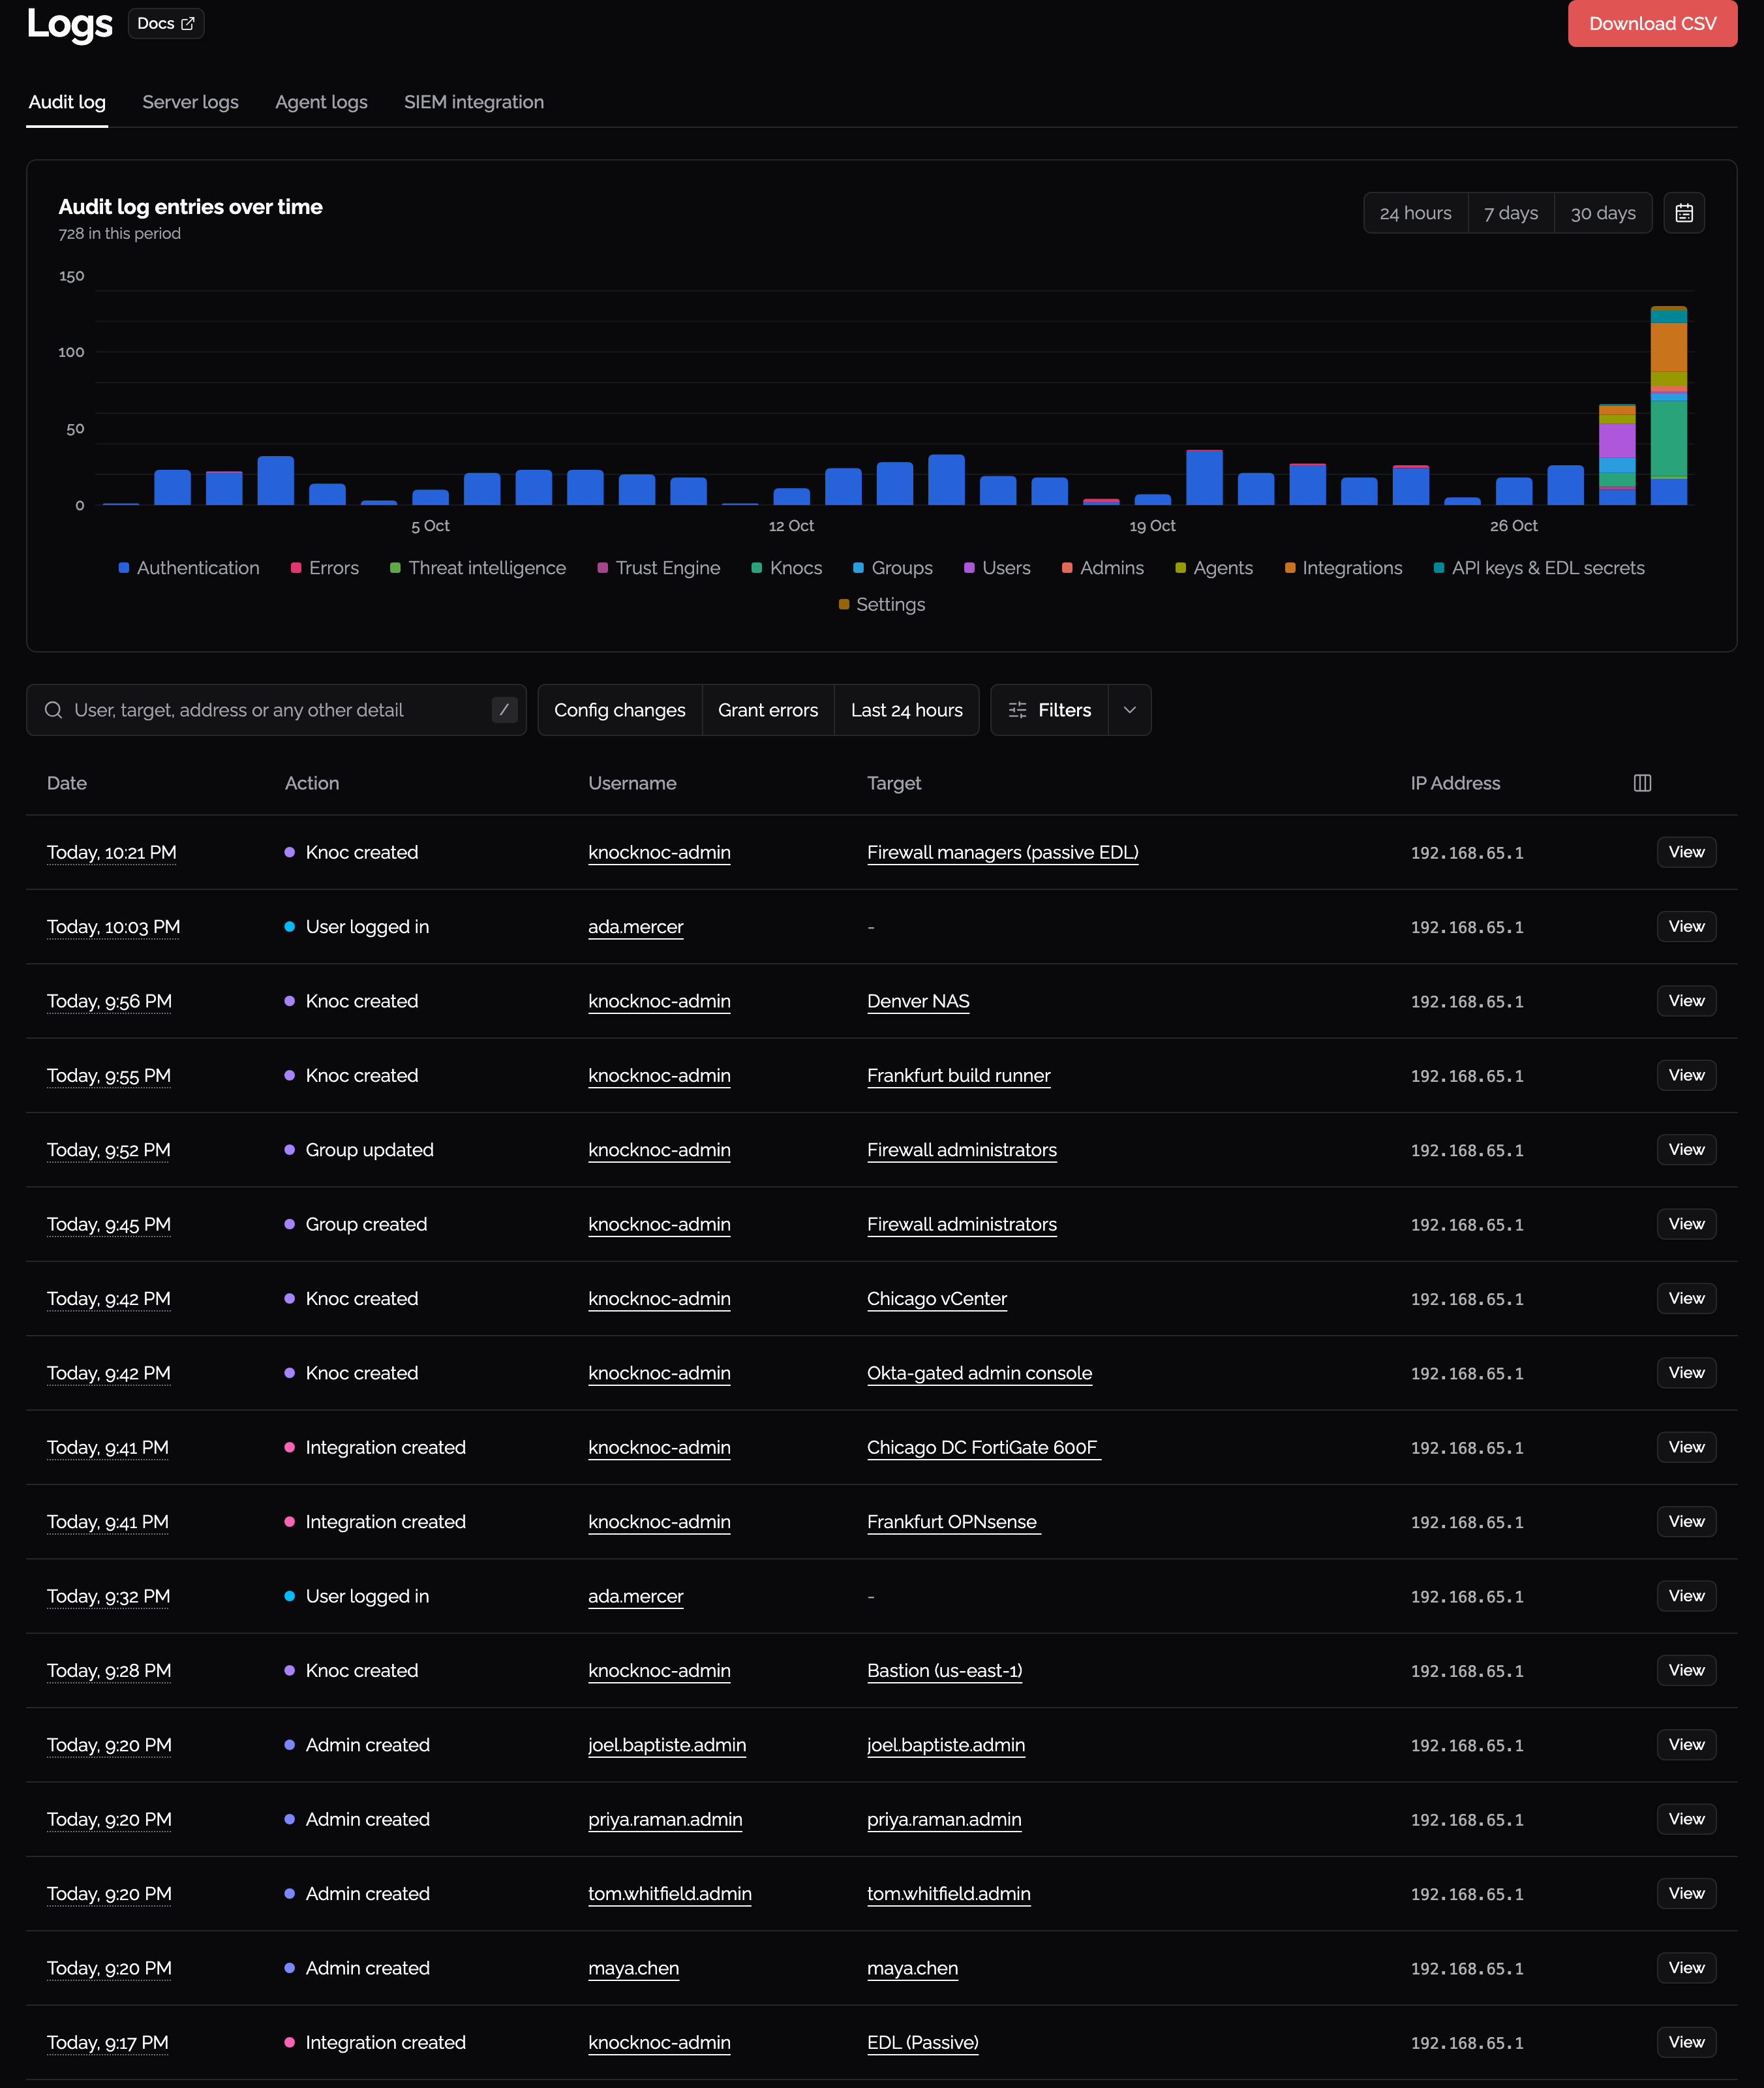
The admin portal’s Logs page opens on Audit log, which shows recent Knocknoc activity: logins, access grants, manual interactions and administrative changes. A chart above the table counts entries by category over 24 hours, 7 days or 30 days. One search box matches a user, a target, an address or any other detail. Config changes, Grant errors and Last 24 hours are one-click presets, and Filters holds the rest. Download CSV exports the current view.
Server logs
Logs > Server logs shows the last 500 lines of the Knocknoc server's own log. Use it to see what the server was doing when something went wrong, without needing shell access to the host.
Server logs are not shown on Knocknoc Cloud.
Agent logs
Logs > Agent logs fetches recent log entries from one agent, so you can troubleshoot an agent without signing in to the machine it runs on.
- Pick the agent from the list. With only one agent, it is chosen for you.
- The agent's recent entries load. Trace and debug lines are hidden to start with; turn them on with the level buttons above the feed.
- Click Refresh to fetch the latest entries.
The agent must be connected for its logs to be fetched. An offline agent is marked "(offline)" in the list. Agents released before log retrieval was added cannot send their logs. Upgrade the agent to the latest version to use this tab.
For older entries, read the agent's log on the host, as described in "Where do the server and agent logs go?" below.
Where do the server and agent logs go?
On Linux - Agent and Server logs go to your default built-in Linux logger, which is likely either Journald or Syslog (rsyslog etc). You can view these with "journalctl -fu knocknoc" or "journalctl -fu knocknoc-agent" to tail the logs, or otherwise interact with them. If you're using syslog/rsyslog, or prefer to install rsyslog, they will be in tail -f /var/log/syslog or similar.
On Windows - Agent logs are written to a file in your install directory /logs. These are automatically rotated for you, point a SIEM tool to this folder to collect them. Basic start/stop logs go to EventViewer. Read more here.
On OpenBSD - The agent on OpenBSD uses rcctl, so logs can be retrieved from /var/log/daemon. You can see a like view of the logs by running "tail -f /var/log/daemon | grep knocknoc_agent".
What about my SIEM ingestion?
Depending on your SIEM, and your host configuration (Linux journald/syslog or Windows), these should be either automatically collected from your SIEM agent, or may need some configuration. Your Windows Agent will almost always need configuration to read from the logs folder, whereas Linux should be automatic.
Below are some links to various SIEM configuration guides, but essentially "journald" for Linux, and /logs folder for Windows.
-
Splunk (Splunk Enterprise / HF / UF): native Journald input. (Splunk Docs)
-
Elastic SIEM / Elastic Stack: Filebeat
journaldinput reads viajournalctl. (Elastic) -
Fluent Bit:
systemdinput plugin (journald) + your output of choice. (Fluent Bit Documentation) -
Vector:
journaldsource (usesjournalctl) + sinks to many backends. (Vector) -
Grafana Loki: Promtail
journalscrape block for systemd journal. (Grafana Labs) -
Datadog: Agent supports journald log collection via the
journaldintegration. (Datadog) -
Microsoft Sentinel: ingests Syslog / CEF via AMA. Typical pattern:
journald → rsyslog (imjournal) → Sentinel. (Microsoft Learn) -
Loggly: standard approach is rsyslog/syslog forwarding. Use
imjournalif you’re starting from journald. (SolarWinds Documentation) -
Solarwinds/Papertrail: has a specific guide to forward
journalctloutput to Papertrail. (Papertrail) -
Sumo Logic: explicit doc: send journald logs to a Sumo Collector/Syslog Source. (Sumo Support)
-
CloudWatch Agent primarily tails log files. Journald collection is commonly done by shipping via Fluent Bit (systemd input) → CloudWatch Logs output instead. (AWS Documentation)
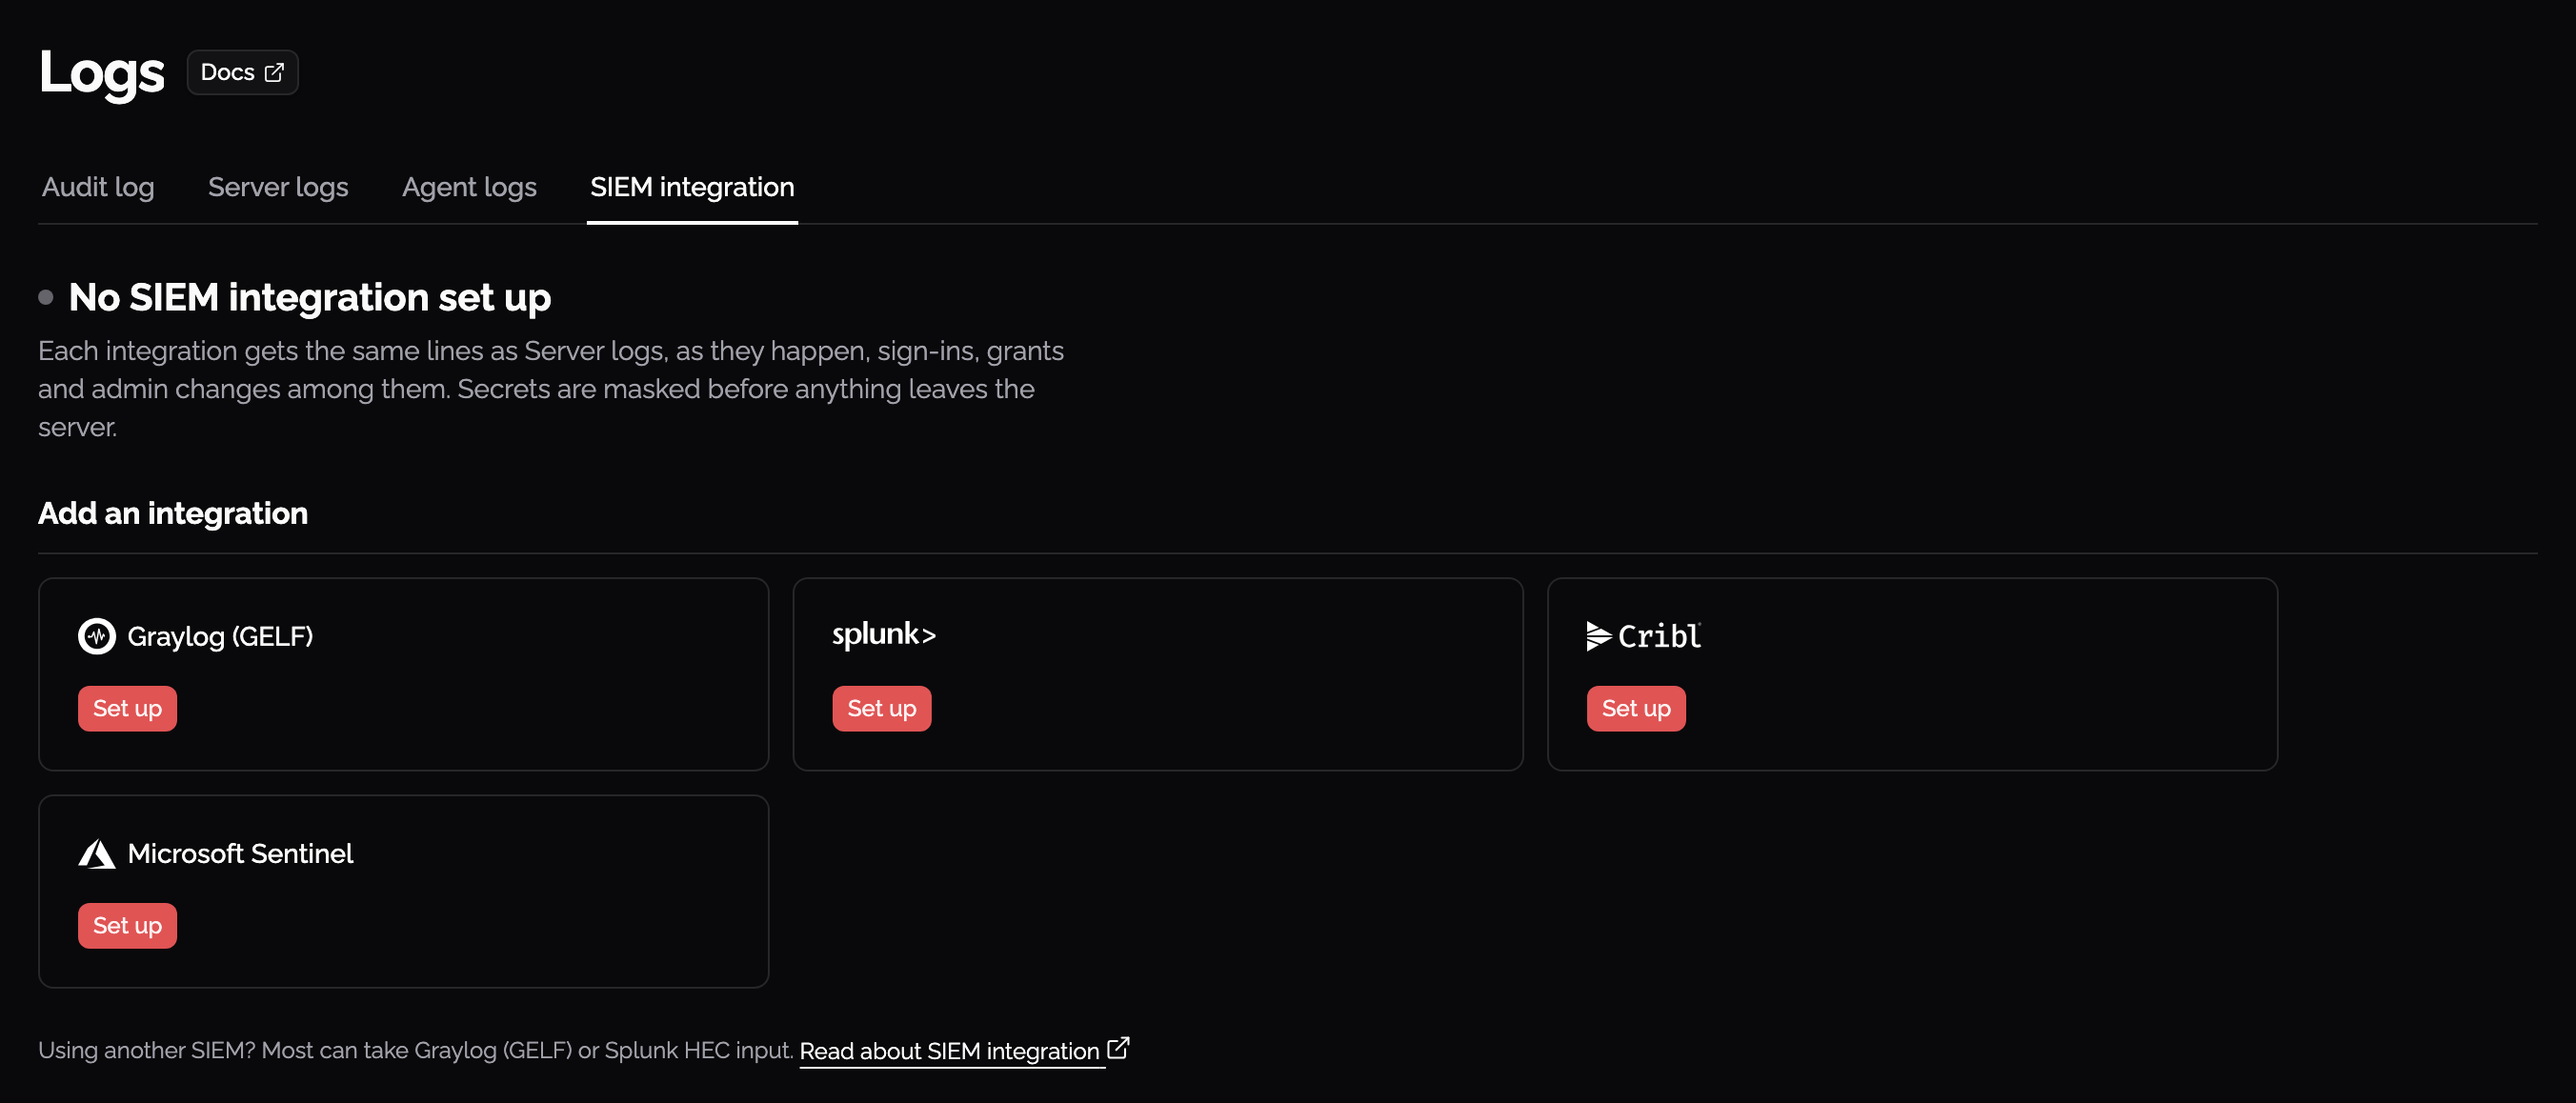
Knocknoc can also push the same lines straight to a GELF listener, set under Logs > SIEM integration. GELF has no encrypted transport, so udp:// and tcp:// are the whole choice and the lines arrive as plaintext. They carry usernames and IP addresses, so keep the listener on a network you trust. Where you cannot, collect from the journal as above and let your own agent encrypt what it forwards.
Sending logs straight to Splunk, Cribl or Microsoft Sentinel
Everything above collects Knocknoc's logs from the host. Knocknoc can also post them to a collector itself, with nothing installed on the host and no journal to read. That is the usual choice for Knocknoc Cloud, where you don't control the server, and it's an option on a self-hosted deployment where you'd rather not run a log agent.
All of it is configured on the SIEM integration tab of this page. The four integrations are independent and you can run any combination at once. Shipping is a copy: the same lines keep going to journald or Event Log as before, so turning this on never takes away the logging you already have.
Splunk - Knocknoc posts to a Splunk HTTP Event Collector. Set the Collector URL to your collector, for example https://splunk.example.com:8088. A full /services/collector or /services/collector/event path is accepted too. Paste the token Splunk issued into HEC token. Index and Sourcetype are optional, defaulting to whatever the token is configured for and to knocknoc:event.
Check the index name carefully. If you name an index that does not exist, Splunk's collector still answers with success and then discards every event at the indexer. Knocknoc has no way to know, so nothing is reported and the settings page looks healthy while all your logs go nowhere. Splunk records it in its own internal index:
WARN IndexerService - Received event for unconfigured/disabled/deleted index=knocknoc_eventsCreate the index in Splunk first, and if lines never arrive, search index=_internal IndexerService before looking anywhere else.
Indexer acknowledgement has to be off on the token Knocknoc uses. With it on, the collector refuses every batch with 400 Data channel is missing and nothing is indexed. The failure is at least loud, and it shows up in the server log as a shipping warning.
Cribl - Knocknoc posts to a Splunk HEC source on Cribl Stream, Edge or Cloud. Set its URL and Auth token. A worked example, using Cribl's built-in source:
-
In Cribl, open Manage -> Data -> Sources and enable Splunk HEC. It listens on port 8088 at
/services/collector. -
Add an auth token on that source and copy it. Cribl will accept a source with no token, which lets anyone post to it, so Knocknoc insists on one.
-
In Knocknoc, set the URL to
https://cribl.example.com:8088. A bare host gets Cribl's default path. If you moved the source's endpoint, give that path instead and Knocknoc adds/eventto it. A URL ending in/rawor/s2sis refused, because only/eventparses the JSON envelope. -
Add whatever destination you want in Cribl and route the source to it. Sending it on to Splunk is the common case, and the sourcetype and host Knocknoc sets are carried through unchanged.
The point of putting Cribl in the middle is everything Cribl is good at: trimming fields you don't want to pay to index, routing one stream to several destinations, or holding events while a destination is down.
Microsoft Sentinel - Knocknoc posts to the Azure Monitor Logs Ingestion API, which needs a few things created in Azure first: a data collection endpoint, a data collection rule with a custom table, and an app registration holding the Monitoring Metrics Publisher role on that rule. Then fill in Ingestion endpoint (the endpoint's logs ingestion URL), Data collection rule ID (the rule's immutable ID, on its overview page in the portal), Stream name (the input stream the rule declares, such as Custom-Knocknoc_CL), and the Directory (tenant) ID, Application (client) ID and Client secret from the app registration.
Secrets are write-only. The HEC token and the Sentinel client secret are never sent back to the browser. The field shows that one is saved rather than its value, and leaving it blank on a later save keeps what's stored. To replace one, type the new value. To remove one, clear the receiver's URL, which drops its secret with it.
What it costs you. Lines are queued and sent in batches, on a background worker. A collector that is slow, unreachable or wedged never delays a login or a grant. If a collector stays down, lines are lost for the duration rather than queued to disk, and the server log says so once a minute with a count of what was lost.
Throughput depends on how far away the collector is, because one batch is in flight at a time and a batch holds up to 200 lines. A collector 20ms away absorbs several thousand lines a second, which is far more than a busy server produces. One 200ms away is nearer 1,000 lines a second, which is still comfortable but worth knowing if you expect a burst of hundreds of simultaneous logins. Past that, batches are dropped and counted rather than queued without limit.
Log format and "KnocknocEvent"
Importantly, Knocknoc events include a string "KnocknocEvent" followed by a collection of relevant key/value pairs, which can be parsed out by your favorite log aggregator/SIEM, or easily searched through syslog.
For example:
KnocknocEvent=LoginUser User=demouser ip=203.0.113.24 UserType=local request_id=cv041e4nqrrqhd74hk4g uid=0194cebb-506f-7769-bd65-b57b9bc3a4c0
| KnocknocEvent | Event | Additional data |
|
|
Successful user/admin login Successful user/admin logout |
Username, IP Address, Auth type (e.g., SAML, Local) UID/internal user-id, request_ID for tracking linked events |
|
|
Granting of access to users, via Agents Manual (click to grant) interactions Additional IPs discovered as part of port-walking |
Username, IP Address, Auth type (e.g., SAML, Local), UID, ACL Name, ACLID, Request_ID Any additional IPs in the case of PortWalkGrant |
AllowlistRetrieved |
API-based AllowLists successfully retrieved by consumers, eg: firewalls polling EDLs | ACL Name, IP Address (of consumer), ACLID, Format (txt/json), Request_ID |
AdminManualGrant |
A "break glass" grant created by an Admin user, who provides an arbitrary IP address for emergency purposes | The IP is provided by the authorized Admin |
TOTPInvalid TOTPInvalidUserTOTPValidAdmin TOTPValidUser |
Invalid TOTP provided (on valid Password) Valid TOTP provided Note: local users only, does not appear from SAML. |
Username, request_ID |
GrantErrorRevokeError |
An agent could not apply a grant, or could not revoke one. Logged at warning level with outcome=failure, and recorded in the Audit Logs page at the same time |
UserName, AgentName, AclDescription, AclId, KnocDescription, KnocId, ErrorMessage, IpAddress, Request_ID ACL carries the same value as AclDescription so existing syslog searches keep working IpAddress is left out when the grant has no valid address |
|
Audit events for logging of system/data change:
|
Create entities Delete entities Update entities Reset TOTP for local users/admins |
Includes related information, including: Entity type (e.g., user, agent, ACL, etc) Entity name (e.g., Bob User) Performing user (e.g., Jane Admin)
IP address, internal IDs, request_ID |
|
Configure your SIEM to monitor/alert on these:
|
Code paths that are unlikely to occur except in cases of misconfiguration or represent signs of attack, where the attack/path is thwarted, will log a "suspicious" event. These should be monitored/alerted by your SIEM. |
This varies depending on the code path, but may include:
ACL, Backend, API, Username, other |
These events are logged to Syslog for onward collection and parsing.
This can flow to a SIEM or other log aggregation/analysis platform, and become signal for active orchestration (e.g., terminate user sessions) to contain or terminate users that may show signs of compromise - terminating their access at the network level regardless of EDR deployment on the malicious source/system.
If you require additional logging you can manage the verbosity, however these logs are all by-default and on the 'info' verbosity level.
Some examples:
KnocknocEvent=LoginUser ip=203.0.113.24 UserName=dwight.schrute UserType=SAML request_id=xx uid=yy
KnocknocEvent=CreateGrant User=dwight.schrute ACL="Palo45" ip=203.0.113.24 ACLID=xx GrantID=yy UserType=SAML request_id=zz
KnocknocEvent=ManualGrant ACL="Fortinet8" UserName=dwight.schrute request_id=xx
KnocknocEvent=LogoutUser User=dwight.schrute UserType=SAML request_id=xx uid=yy
KnocknocEvent=AllowlistRetrieved ACL="SSH-NYC4" ip=198.51.100.7 aclID=xx format=txt request_id=yy
KnocknocEvent=LoginAdmin User=bob-admin ip=203.0.113.41 UserType=local request_id=xx uid=yy
KnocknocEvent=TOTPValidAdmin User=bob-admin request_id=xx
KnocknocEvent=UpdateSettings User=bob-admin request_id=xx
KnocknocEvent=LicenseKeyValidationSuccessful Expiry=2025-03-31T00:00:00Z SessionLimit=10 UserLimit=25
KnocknocEvent=CreateAgent User=bob-admin Agent={"ID":"0xx","Name":"rhel9-aws"} request_id=xx
KnocknocEvent=TOTPInvalid User=bob-admin request_id=xx
KnocknocEvent=suspicious User=bob-admin request_id=xx
Verbosity: Agent or Server logs (for debugging)
Sometimes you need to debug, adding the below to the Server or the Agent, then restarting, will give you some log goodness:
# log settings (Agent or Server)
LogLevel = "info" # normal
#LogLevel = "trace" # super verbose