
Logging
Logging is important - we love logging.
Because of this, we have included an easy to find, follow and parse log output that provides an additional layer of visibility across your Knocknoc user activity, including logins, access grants, manual interactions, as well as Administrative and management operations.
Audit Logs in the admin portal
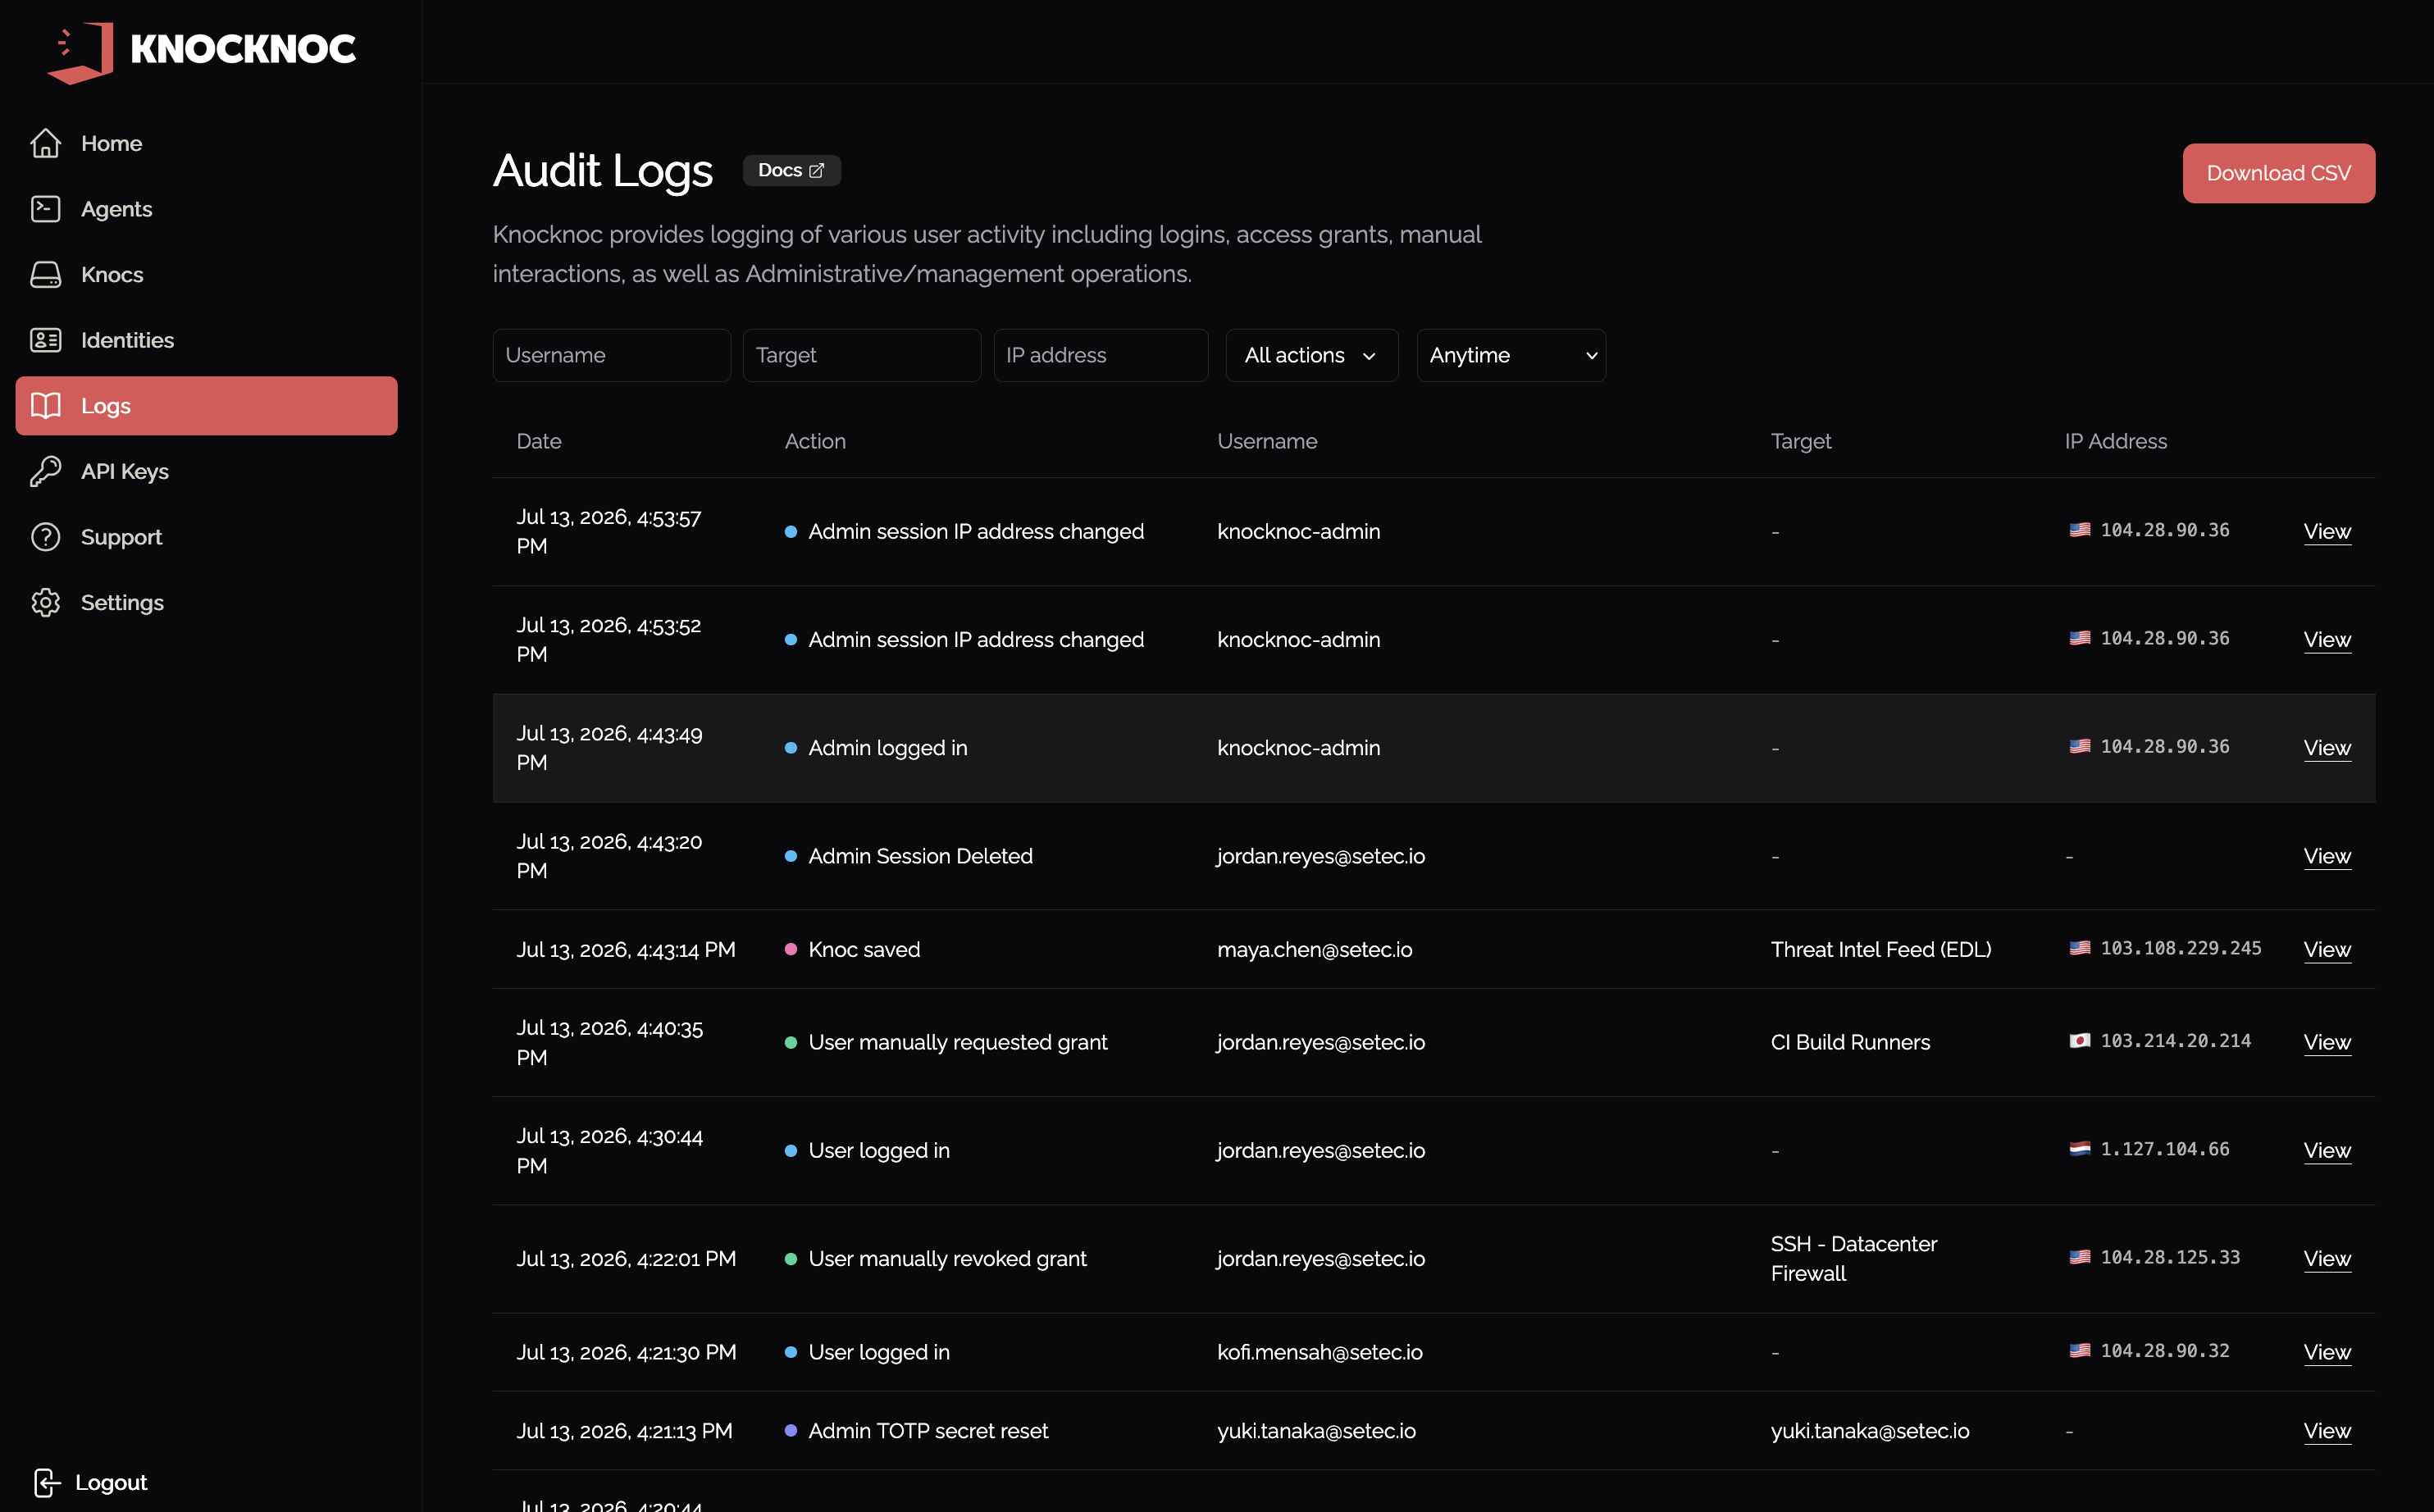
The admin portal has an Audit Logs page showing recent Knocknoc activity: logins, access grants, manual interactions, and administrative changes. You can narrow the list with Filter by action, and search by Username, Target, and IP address. Use Download filtered results to export the current view as CSV.
Where do the server and agent logs go?
For a quick look without leaving the portal, the admin Support page can show the last 500 lines of the server log (View recent server logs), recent entries from a connected agent (View recent agent logs), and the application logs (View app logs). For full history, retention, and forwarding to a SIEM, the logs are written to the locations below.
On Linux - Agent and Server logs go to your default built-in Linux logger, which is likely either Journald or Syslog (rsyslog etc). You can view these with "journalctl -fu knocknoc" or "journalctl -fu knocknoc-agent" to tail the logs, or otherwise interact with them. If you're using syslog/rsyslog, or prefer to install rsyslog, they will be in tail -f /var/log/syslog or similar.
On Windows - Agent logs are written to a file in your install directory /logs. These are automatically rotated for you, point a SIEM tool to this folder to collect them. Basic start/stop logs go to EventViewer. Read more here.
On OpenBSD - The agent on OpenBSD uses rcctl, so logs can be retrieved from /var/log/daemon. You can see a like view of the logs by running "tail -f /var/log/daemon | grep knocknoc_agent".
What about my SIEM ingestion?
Depending on your SIEM, and your host configuration (Linux journald/syslog or Windows), these should be either automatically collected from your SIEM agent, or may need some configuration. Your Windows Agent will almost always need configuration to read from the logs folder, whereas Linux should be automatic.
Below are some links to various SIEM configuration guides, but essentially "journald" for Linux, and /logs folder for Windows.
-
Splunk (Splunk Enterprise / HF / UF): native Journald input. (Splunk Docs)
-
Elastic SIEM / Elastic Stack: Filebeat
journaldinput reads viajournalctl. (Elastic) -
Fluent Bit:
systemdinput plugin (journald) + your output of choice. (Fluent Bit Documentation) -
Vector:
journaldsource (usesjournalctl) + sinks to many backends. (Vector) -
Grafana Loki: Promtail
journalscrape block for systemd journal. (Grafana Labs) -
Datadog: Agent supports journald log collection via the
journaldintegration. (Datadog) -
Microsoft Sentinel: ingests Syslog / CEF via AMA. Typical pattern:
journald → rsyslog (imjournal) → Sentinel. (Microsoft Learn) -
Loggly: standard approach is rsyslog/syslog forwarding. Use
imjournalif you’re starting from journald. (SolarWinds Documentation) -
Solarwinds/Papertrail: has a specific guide to forward
journalctloutput to Papertrail. (Papertrail) -
Sumo Logic: explicit doc: send journald logs to a Sumo Collector/Syslog Source. (Sumo Support)
-
CloudWatch Agent primarily tails log files. Journald collection is commonly done by shipping via Fluent Bit (systemd input) → CloudWatch Logs output instead. (AWS Documentation)
Log format and "KnocknocEvent"
Importantly, Knocknoc events include a string "KnocknocEvent" followed by a collection of relevant key/value pairs, which can be parsed out by your favorite log aggregator/SIEM, or easily searched through syslog.
For example:
KnocknocEvent=LoginUser User=demouser ip=1.2.3.4 UserType=local request_id=cv041e4nqrrqhd74hk4g uid=0194cebb-506f-7769-bd65-b57b9bc3a4c0
| KnocknocEvent | Event | Additional data |
|
|
Successful user/admin login Successful user/admin logout |
Username, IP Address, Auth type (e.g., SAML, Local) UID/internal user-id, request_ID for tracking linked events |
|
|
Granting of access to users, via Agents Manual (click to grant) interactions Additional IPs discovered as part of port-walking |
Username, IP Address, Auth type (e.g., SAML, Local), UID, ACL Name, ACLID, Request_ID Any additional IPs in the case of PortWalkGrant |
AllowlistRetrieved |
API-based AllowLists successfully retrieved by consumers, eg: firewalls polling EDLs | ACL Name, IP Address (of consumer), ACLID, Format (txt/json), Request_ID |
AdminManualGrant |
A "break glass" grant created by an Admin user, who provides an arbitrary IP address for emergency purposes | The IP is provided by the authorized Admin |
TOTPInvalid TOTPInvalidUserTOTPValidAdmin TOTPValidUser |
Invalid TOTP provided (on valid Password) Valid TOTP provided Note: local users only, does not appear from SAML. |
Username, request_ID |
|
Audit events for logging of system/data change:
|
Create entities Delete entities Update entities Reset TOTP for local users/admins |
Includes related information, including: Entity type (e.g., user, agent, ACL, etc) Entity name (e.g., Bob User) Performing user (e.g., Jane Admin)
IP address, internal IDs, request_ID |
|
Configure your SIEM to monitor/alert on these:
|
Code paths that are unlikely to occur except in cases of misconfiguration or represent signs of attack, where the attack/path is thwarted, will log a "suspicious" event. These should be monitored/alerted by your SIEM. |
This varies depending on the code path, but may include:
ACL, Backend, API, Username, other |
These events are logged to Syslog for onward collection and parsing.
This can flow to a SIEM or other log aggregation/analysis platform, and become signal for active orchestration (e.g., terminate user sessions) to contain or terminate users that may show signs of compromise - terminating their access at the network level regardless of EDR deployment on the malicious source/system.
If you require additional logging you can manage the verbosity, however these logs are all by-default and on the 'info' verbosity level.
Some examples:
KnocknocEvent=LoginUser ip=1.2.3.4 UserName=dwight.schrute UserType=SAML request_id=xx uid=yy
KnocknocEvent=CreateGrant User=dwight.schrute ACL="Palo45" ip=1.2.3.4 ACLID=xx GrantID=yy UserType=SAML request_id=zz
KnocknocEvent=ManualGrant ACL="Fortinet8" UserName=dwight.schrute request_id=xx
KnocknocEvent=LogoutUser User=dwight.schrute UserType=SAML request_id=xx uid=yy
KnocknocEvent=AllowlistRetrieved ACL="SSH-NYC4" ip=1.2.3.4 aclID=xx format=txt request_id=yy
KnocknocEvent=LoginAdmin User=bob-admin ip=1.2.3.4 UserType=local request_id=xx uid=yy
KnocknocEvent=TOTPValidAdmin User=bob-admin request_id=xx
KnocknocEvent=UpdateSettings User=bob-admin request_id=xx
KnocknocEvent=LicenseKeyValidationSuccessful Expiry=2025-03-31T00:00:00Z SessionLimit=10 UserLimit=25
KnocknocEvent=CreateAgent User=bob-admin Agent={"ID":"0xx","Name":"rhel9-aws"} request_id=xx
KnocknocEvent=TOTPInvalid User=bob-admin request_id=xx
KnocknocEvent=suspicious User=bob-admin request_id=xx
Verbosity: Agent or Server logs (for debugging)
Sometimes you need to debug, adding the below to the Server or the Agent, then restarting, will give you some log goodness:
# log settings (Agent or Server)
LogLevel = "info" # normal
#LogLevel = "trace" # super verbose